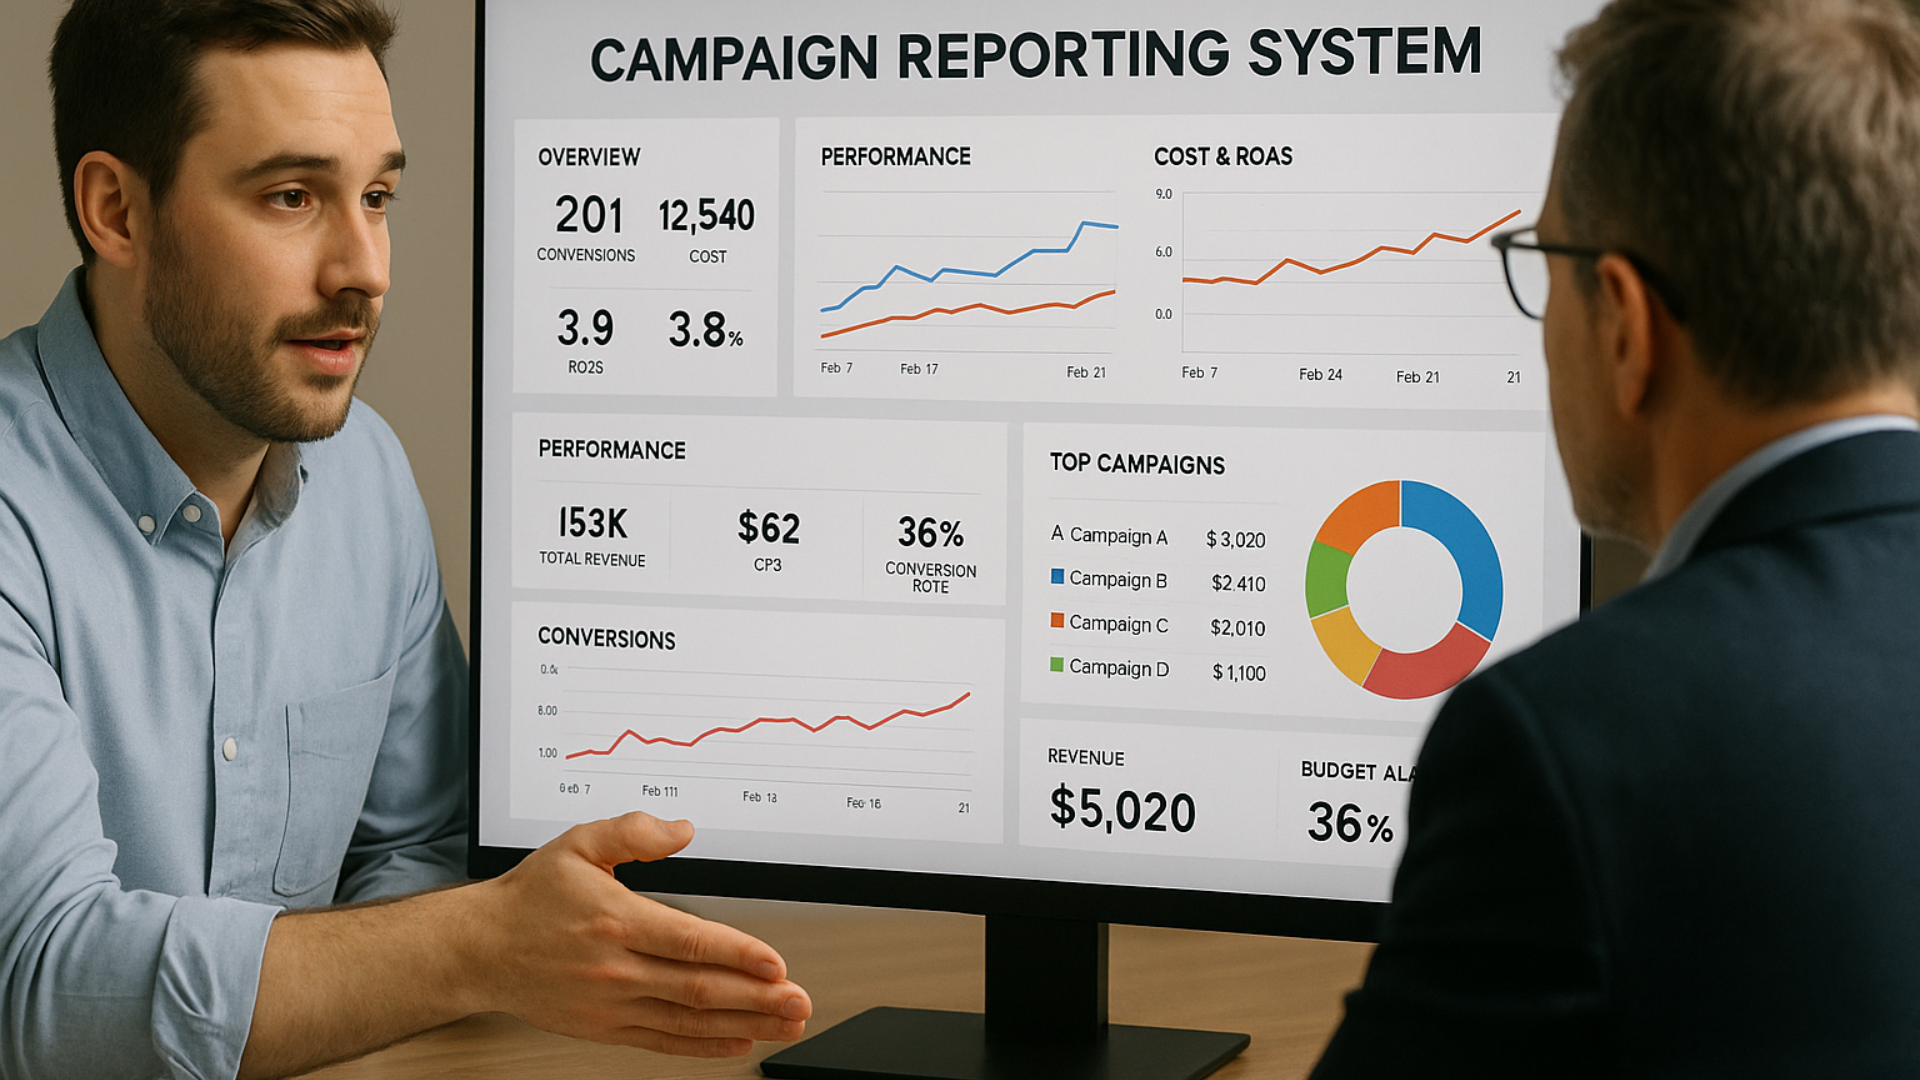
For many traffic managers, running ad campaigns is easy — but explaining results to clients isn’t. Clients don’t just want to see numbers; they want to understand what those numbers mean for their business. Without a clear reporting system, even great results can be misunderstood, leading to confusion or lost trust.
In 2025, with so many platforms and metrics available, simplifying data has become a critical skill. A clean, professional reporting system shows clients that you’re not just running ads — you’re managing growth strategically.
Why Reporting Matters
Transparency builds confidence. Clients who receive regular, clear reports feel in control and are more likely to continue working with you long-term. Reports also help you demonstrate progress, justify decisions, and identify opportunities for improvement.
Without reporting:
- Clients may underestimate your results.
- Miscommunication can cause unnecessary stress.
- You might lose insights that could improve future campaigns.
Good reporting bridges the gap between technical data and business impact.
Step 1: Define the Purpose of the Report
Before building your report, clarify what it’s meant to achieve. Is it to inform, analyze, or persuade?
- Informative reports summarize weekly or monthly performance.
- Analytical reports identify patterns and areas for optimization.
- Strategic reports present insights for future planning.
Most client reports should combine all three — showing what happened, why it happened, and what will happen next.
Step 2: Choose the Right Reporting Frequency
The ideal reporting frequency depends on your client’s campaign size and involvement level.
- Weekly reports are best for active campaigns that require frequent updates.
- Biweekly reports work for steady, ongoing performance.
- Monthly reports are sufficient for long-term tracking and trend analysis.
Avoid daily reporting — it leads to overreaction. Ad algorithms need time to stabilize, and small daily fluctuations don’t reflect real progress.
Step 3: Identify Key Metrics That Matter
Clients don’t need to see every metric in Ads Manager. Focus on the ones that align with business goals.
For example:
- E-commerce clients: ROAS, CPA, conversion rate, average order value.
- Lead generation clients: Cost per lead, lead quality, conversion rate.
- Branding clients: Reach, impressions, engagement rate.
Highlight metrics that show impact, not just activity. Instead of listing “clicks” or “impressions,” emphasize what those metrics led to — conversions, revenue, or brand growth.
Step 4: Use Visualization to Simplify Data
Numbers alone are meaningless without context. Graphs, charts, and color-coded visuals help clients understand performance instantly.
Tools like Google Looker Studio, Supermetrics, and Databox allow you to create automated dashboards with real-time updates.
Use visuals like:
- Line charts for performance trends.
- Pie charts for traffic source distribution.
- Bar graphs for ad creative comparison.
Adding visuals makes reports more engaging and easier to digest.
Step 5: Create a Standardized Format
A consistent structure helps clients quickly understand your reports each time they receive them. Use a professional yet simple layout that includes:
- Executive Summary: Quick overview of performance highlights.
- Key Metrics: The most important KPIs for that period.
- Insights and Analysis: What worked, what didn’t, and why.
- Next Steps: Planned adjustments or experiments.
- Notes: Any external factors (seasonality, algorithm updates, etc.) affecting results.
This format turns data into a story, guiding clients through the numbers with context and purpose.
Step 6: Add Context to Every Metric
Never show a number without explaining what it means. For example:
- Instead of “CTR = 2.3%,” write “CTR increased by 0.5%, indicating improved ad engagement after the new creative launch.”
- Instead of “CPA = $20,” write “CPA decreased by 15%, making lead acquisition more efficient this month.”
Context transforms metrics into actionable insights, helping clients understand how your optimizations are driving results.
Step 7: Automate Whenever Possible
Manually pulling data can waste hours. Automation tools allow you to spend more time analyzing instead of collecting numbers.
Integrate your ad accounts (Meta, Google, TikTok, etc.) into Google Looker Studio or similar platforms. These tools pull real-time data and update dashboards automatically.
Automated reports:
- Save time.
- Reduce human error.
- Provide instant transparency to clients.
You can still send personalized summaries highlighting insights while automation handles the raw data.
Step 8: Highlight Wins and Learnings
Clients want to see progress. Always include a section that highlights wins — such as reduced costs, increased conversions, or improved ad engagement.
However, don’t ignore areas that underperformed. Instead, frame them as learning opportunities and explain what changes you’ll make next. This demonstrates your proactive approach and builds trust.
For example:
“While the lead campaign underperformed on mobile, desktop conversions improved by 40%. We’ll adjust our targeting to balance both devices next week.”
Step 9: Include a Visual of ROI and Budget Allocation
Clients care deeply about how their money is being used. Include a simple breakdown of:
- Total ad spend.
- Revenue or leads generated.
- ROI or ROAS (Return on Ad Spend).
A pie chart showing how budget was distributed across campaigns helps visualize where money went and what worked best.
Step 10: Deliver Reports Professionally
How you present your report matters just as much as its content. Send reports through email with a short summary or present them in live meetings (video or in-person).
During presentations:
- Walk the client through key sections.
- Allow time for questions.
- End with actionable next steps and projections for the upcoming period.
Professional delivery reinforces your credibility and shows that you’re organized and confident in your results.
Turning Reports Into Retention Tools
A great reporting system doesn’t just communicate results — it strengthens relationships. Clear, consistent reports make clients feel informed, respected, and confident in your expertise.
When clients understand your process and see tangible progress, they’re more likely to stay long-term, increase budgets, and refer you to others.
In the world of paid traffic, transparency isn’t optional — it’s your strongest sales tool. Master reporting, and you’ll master client retention.
