In paid advertising, there is one metric that serves as the ultimate measure of whether your campaigns are profitable or not: ROAS, or Return on Ad Spend. While many metrics like click-through rate, cost per click, or impressions help paint a picture of performance, none of them tell you the full financial story. ROAS is the number that shows exactly how much revenue you are generating for every dollar invested in ads, making it a crucial metric for traffic managers, entrepreneurs, and agencies alike. In 2025, as ad costs rise and platforms become more competitive, understanding what makes a good ROAS — and how to consistently improve it — is more important than ever.
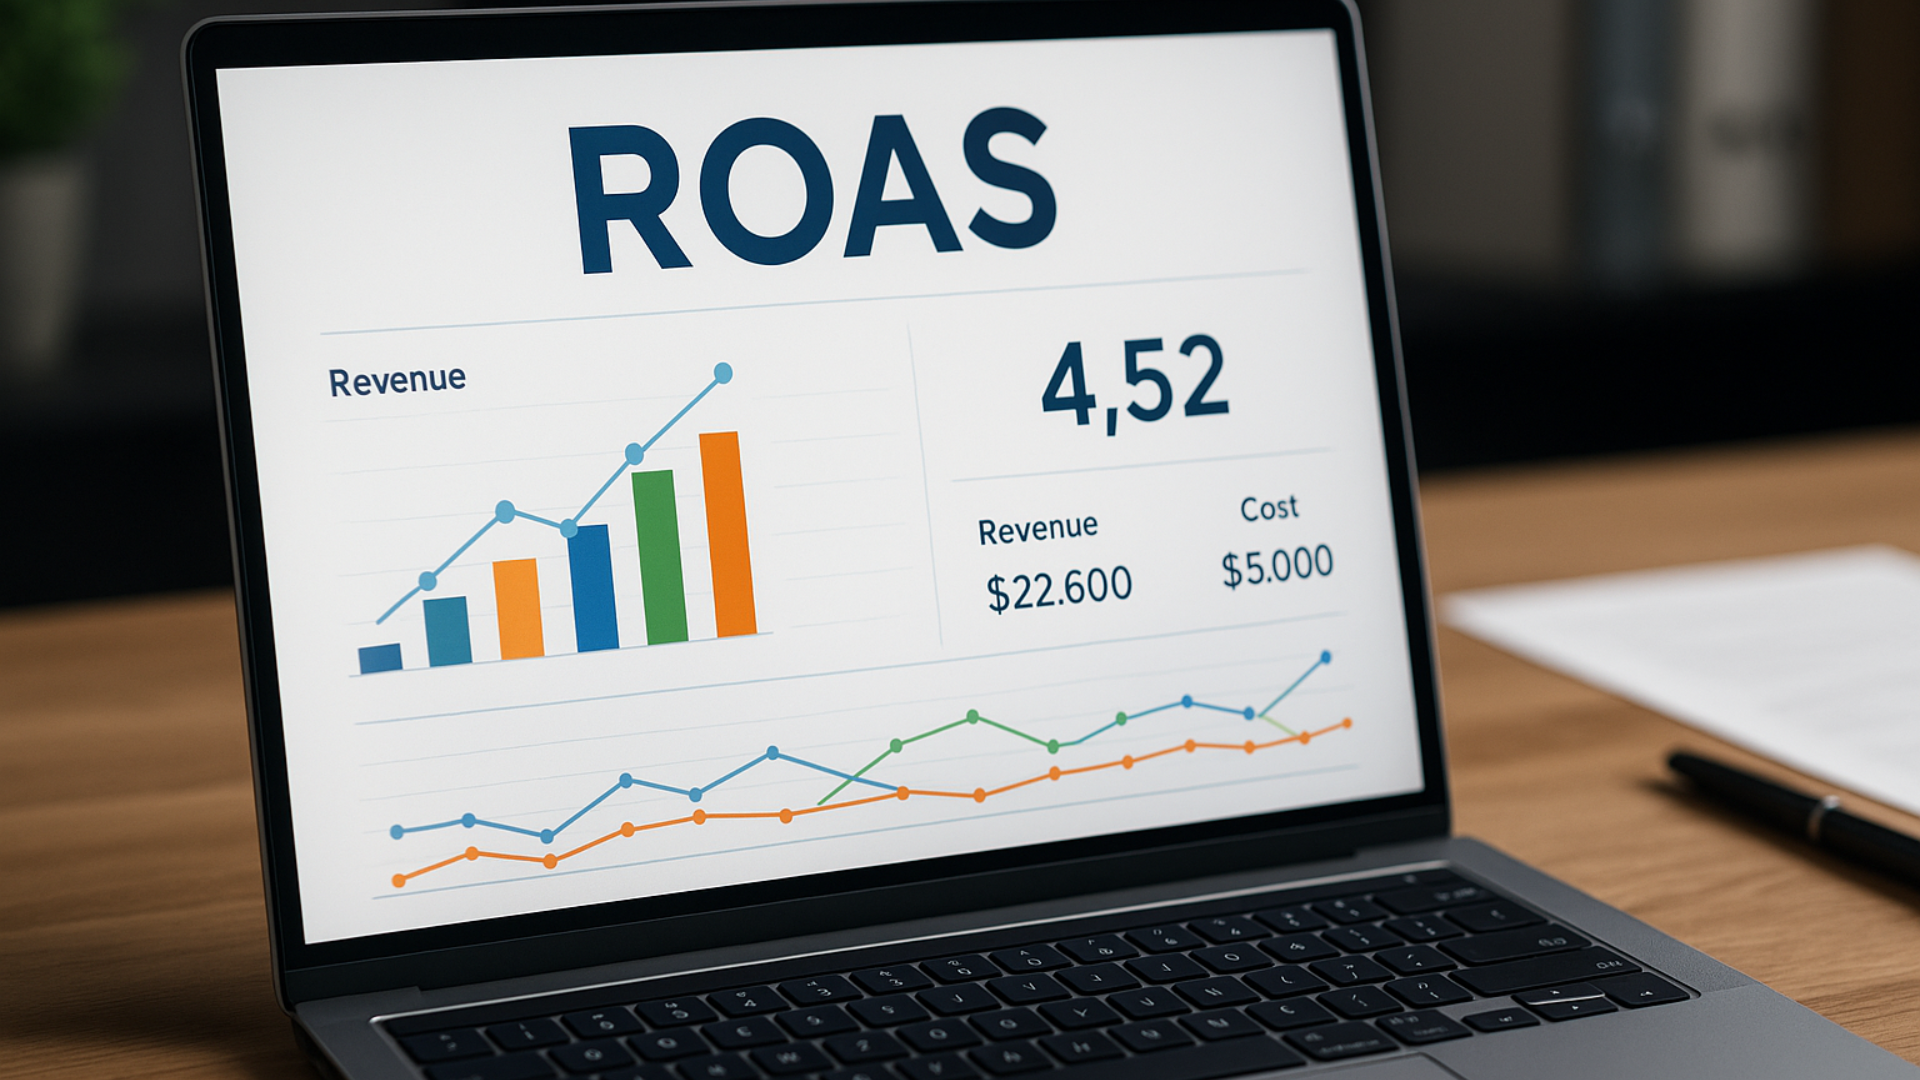
At its simplest, ROAS is a ratio of revenue earned to ad spend. The formula is straightforward: revenue from ads divided by the cost of ads. For example, if you spend $500 and generate $2,000 in revenue, your ROAS is 4.0, which means you made four dollars for every dollar invested. This is not to be confused with ROI, or Return on Investment, which takes into account all other costs such as product production, fulfillment, staff, and software. ROAS is narrower in scope, but that is what makes it such a powerful tool for campaign management: it tells you how well your ads themselves are working, regardless of the other business expenses. Still, understanding the difference between ROAS and ROI is essential because a high ROAS does not always guarantee profitability if your other operational costs are eating into margins.
The reason ROAS matters so much is that it provides a clear, numbers-driven way to measure campaign profitability and compare performance across platforms. Without tracking it, you are essentially flying blind, making decisions based on surface-level data that might look good but hide underlying inefficiencies. ROAS allows you to decide which campaigns to scale, which to pause, and where to allocate your budget more effectively. It also provides concrete proof of performance to clients or stakeholders, something that simple engagement metrics cannot do. Perhaps most importantly, ROAS acts as an early warning system. When it starts to drop, it often signals deeper issues in targeting, creative performance, or funnel health.
So, what is considered a good ROAS in 2025? The answer depends heavily on your industry, product type, and margins. For low-ticket ecommerce products, a ROAS between 2.5 and 4.0 is generally acceptable. High-ticket ecommerce products demand a higher return, often between 4.0 and 6.0 or more, due to higher profit margins and customer acquisition costs. For info products like courses or digital programs, a ROAS between 2.0 and 5.0 is often sustainable. Service providers, such as agencies and coaches, usually aim for between 3.0 and 6.0, while SaaS businesses can survive with a lower ROAS of around 1.5 to 3.0 because they rely on lifetime value rather than immediate returns. Local businesses often aim for 3.0 or higher, balancing smaller budgets with consistent community reach. Ultimately, what makes a “good” ROAS comes down to your profit margins. A brand with a 70% profit margin can survive at a ROAS of 2.0, while another with only a 20% margin may need a 5.0 to stay profitable.
When ROAS is underperforming, it is rarely because of the platform itself. More often, the culprit is poor strategy or execution. Common reasons include targeting the wrong audience, weak creatives that fail to capture attention, ineffective landing pages that don’t convert, low conversion rates throughout the funnel, or even a mismatch between the product and the market. Understanding these issues is critical, because fixing them directly improves ROAS. For instance, if your creatives aren’t engaging enough to drive clicks, your cost per click will be high and your conversions low, leading to weaker returns. Similarly, if your landing page doesn’t match the promise of your ad or takes too long to load, visitors may leave before converting, again driving ROAS down.
Improving ROAS requires a multi-layered approach. First, increasing your conversion rate is one of the most effective levers. Even small changes, like improving your landing page headline, adding testimonials for social proof, or simplifying your call to action, can significantly increase results. If your site is converting at two percent and you increase that to three percent, you’ve instantly increased revenue by fifty percent without spending more on ads. Second, lowering your cost per acquisition is equally powerful. This can be done by testing more relevant creatives, targeting audiences more precisely, and setting up retargeting campaigns that convert warm leads who are already familiar with your brand. Third, increasing your average order value raises ROAS almost automatically. Offering bundles, upsells, or cross-sells increases the amount of revenue per purchase, so even if your ad costs remain the same, your returns rise. Fourth, retargeting plays a crucial role, as most visitors won’t convert the first time. Showing ads to cart abandoners, past site visitors, or people who engaged with your content often yields much higher ROAS compared to cold audiences. Lastly, focusing budgets on high-performing campaigns while pausing underperforming ones is one of the simplest yet most effective ways to maintain profitability.
Tracking ROAS properly is just as important as improving it. Platforms like Meta Ads Manager and Google Ads dashboards provide built-in ROAS metrics, but for more advanced tracking, tools like Google Analytics 4, Triple Whale, Hyros, or Segmetrics help unify cross-channel data. Ecommerce platforms like Shopify and WooCommerce also provide native ROAS tracking. Using UTM parameters ensures accuracy by linking revenue back to the right campaigns. With reliable tracking, you can make informed decisions about which campaigns to scale, where to cut spend, and how to allocate resources across platforms.
In terms of benchmarks, averages vary across platforms in 2025. On Facebook and Instagram, ROAS tends to fall between 2.0 and 4.0. Google Search often delivers higher returns, between 3.0 and 5.0, while Google Display typically delivers lower returns in the 1.5 to 3.0 range. YouTube sits between 2.0 and 4.0, while TikTok’s average hovers between 1.5 and 3.0, reflecting both its competitive CPMs and its audience’s tendency toward lower-ticket purchases. Pinterest, often overlooked, delivers between 1.8 and 3.5. These are averages, and your actual performance may differ dramatically depending on your niche, offer, and funnel quality.
Ultimately, ROAS is the north star metric of paid advertising. If you want to run profitable campaigns, scale confidently, and make data-driven decisions, you must track and optimize ROAS relentlessly. When your ROAS is strong, you not only protect your budget but also create opportunities for growth, impress stakeholders with tangible results, and reduce risk while scaling campaigns. In 2025, with rising ad costs and intensifying competition, the advertisers who thrive will be those who focus not just on reach or clicks but on returns. ROAS is not just a metric — it is the foundation of sustainable advertising success.